Embedded reporting integrates database data into an existing application. The database data can be scoped to specific users and presented in different ways. This allows users to view, filter, and explore their unique data subsets. For instance, when "Sally Smith" logs into your application, an embedded table could display only her products sold and their corresponding sales dates.
There are quite a few solutions on the market that provide embedded reporting. Which is best? That depends on your goals. Are you trying to allow your customers to build, export, and explore their data? Then Tableau is probably not the choice for you. Are you trying to create complicated visualizations for your customer? Then Tableau is a contender. This guide will walk you through using and embedding Tableau in a working application.
Table Of Contents
1. Pick a tool that matches your goals
Before investing time and resources into embedded reporting, it's crucial that you clearly understand your customers' needs. There are numerous instances where companies have dedicated weeks to building custom visualizations, only to learn that these visualizations didn't solve the underlying problem. Do your customers require maps or complex charts? Or are they looking to view, filter, and export their data to their preferred tools? Understanding your customers' business goals and tool preferences is critical. You might think they want graphs, but they really need a specifically formatted data dump for Excel-based analysis. Tableau is a tool specifically designed for data analysts and has a steep learning curve. It may require a full-time consultant to maintain your dashboards and data sources. On the other hand, if your needs revolve around exploring, exporting, and filtering data, a tool like HelloQuery could be a faster and simpler solution to implement and maintain. Choose wisely based on your specific needs and capabilities.
2. Getting started with Tableau
Tableau might be the perfect solution if you're aiming to create intricate, interactive dashboards. However, keep in mind that this robust business intelligence tool requires skilled personnel, adequate time, and financial investment for effective implementation.
Let's delve into the basics. Tableau offers several products, each tailored to different needs and environments. They include Tableau Desktop, Tableau Server, and Tableau Cloud. This tutorial will focus on Tableau Cloud, a hosted version of Tableau Server that allows you to share dashboards and collaborate in the cloud.
3. Sign up for Tableau Cloud
Begin by visiting https://www.tableau.com/products/trial to register for a free 7-day trial of Tableau Cloud.
You will receive an email to activate your trial. However, clicking the link reroutes you back to the main Tableau page instead of directing you to Tableau Cloud, which can be somewhat confusing.
If you lose your way, the direct login path is https://sso.online.tableau.com/public/idp/SSO.
After you log in, you'll be prompted to name your site and select your location.
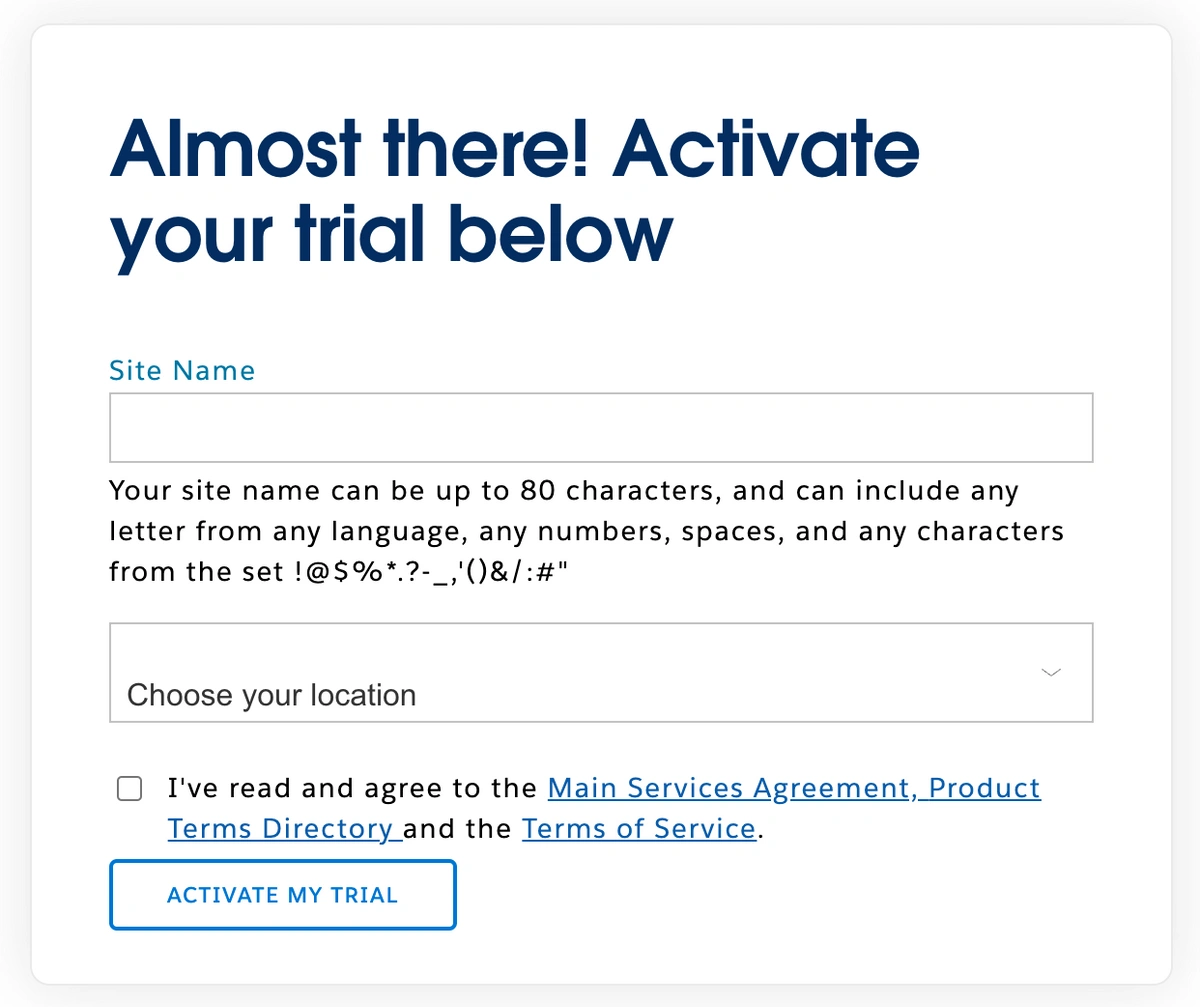
Once you've activated your trial, you'll land on a page showcasing several sample data sets. These clean data sets are perfect for tinkering as you familiarize yourself with Tableau and start building visualizations. This tutorial focuses on embedded data that serves a practical purpose, so our next step will be to connect a live data source.
4. Connect a datasource
If you're new to the platform, the Tableau home screen can appear overwhelming. The initial steps involve creating a project and a workbook, which we'll guide you through.
To create a new project select New → Project
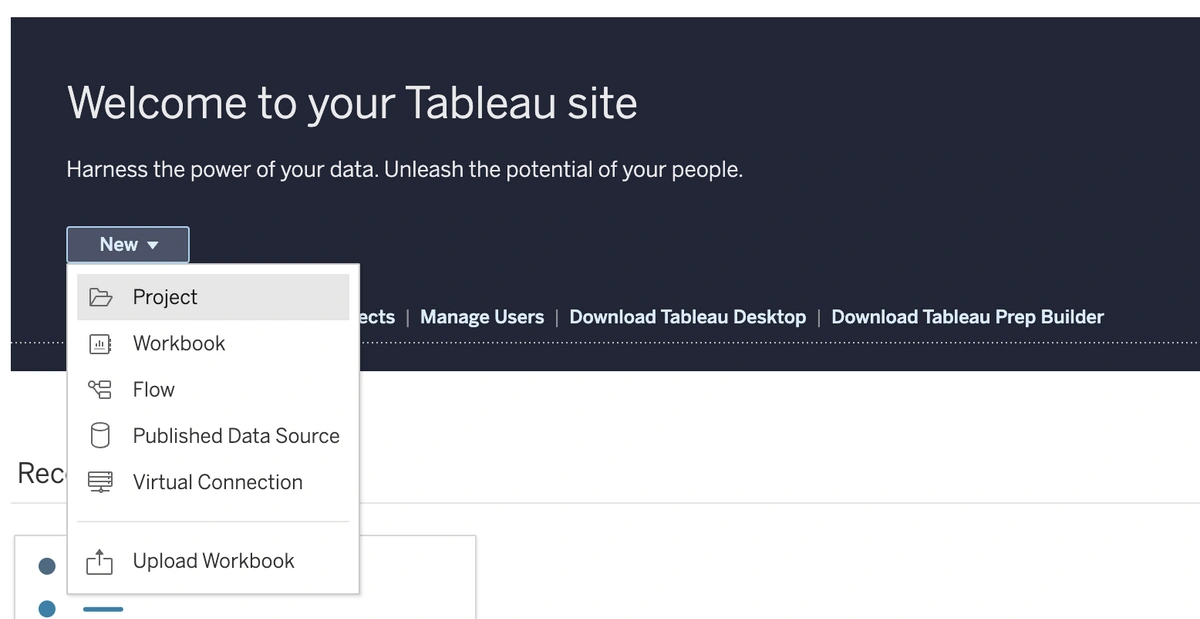
After naming your project, the next step is to create a new Workbook. Select New → Workbook.
You will be redirected to a new Workbook. A modal will pop up titled Connect To Data.
This is where you define your data source. You’ll need read only credentials to your cloud hosted database.
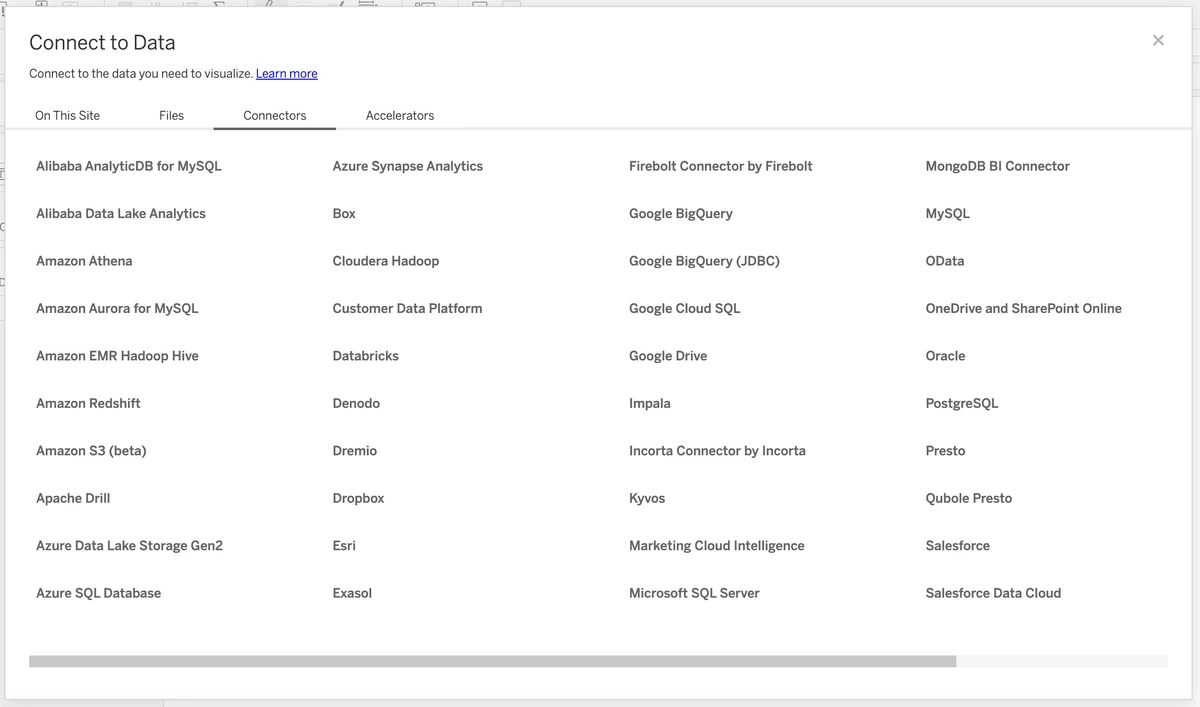
Select your data source and enter your credentials. For this tutorial we’re using a cloud hosted Postgres database, but you can use any data source.
5. Organize your data
After successfully connecting to a data source, you will see a screen similar to the one below.
In this step, you select the data that you want to be included in your visualization. In this tutorial, we'll use the buckets and images tables. Drag the required tables to the center of the screen.
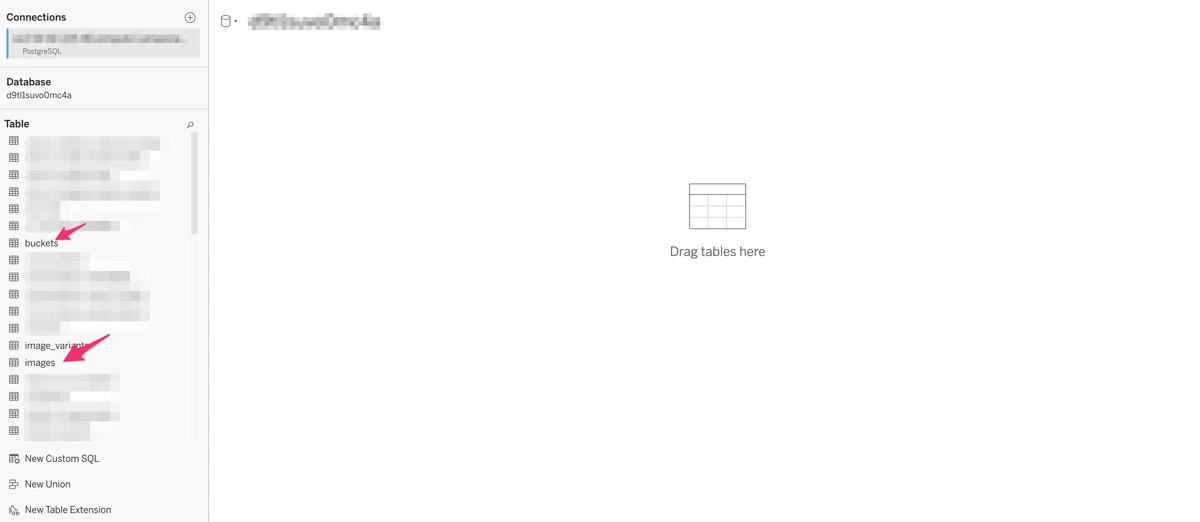
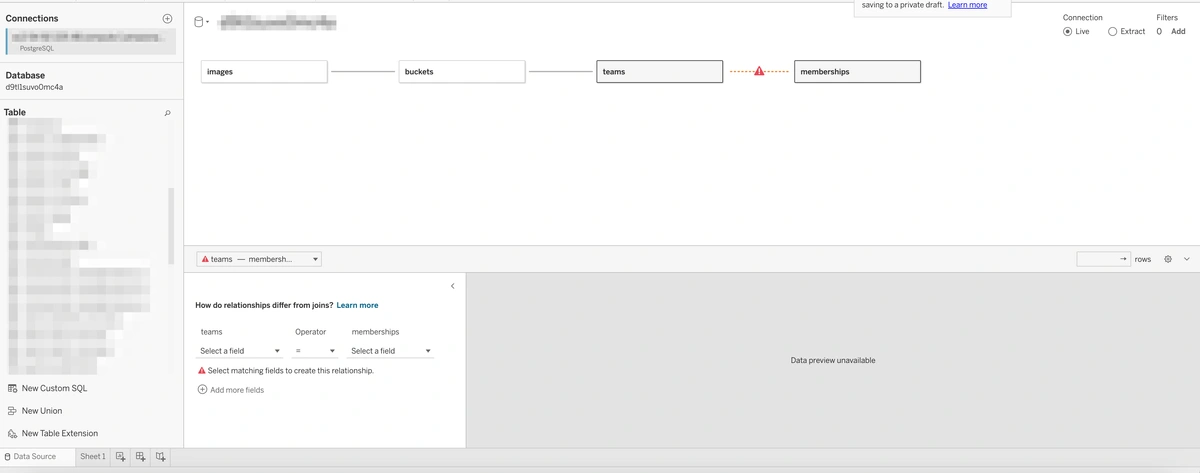
Tableau automatically tries to discern the relationships between tables. It manages standard foreign key relationships quite well but may stumble with join tables.
For example, the data model shown below features a membership table linking users and teams, which Tableau struggled to interpret. However, you can manually specify the keys in the provided dialogue box.
Once your data model is defined in Tableau, you must click the Publish button in the upper right-hand corner.
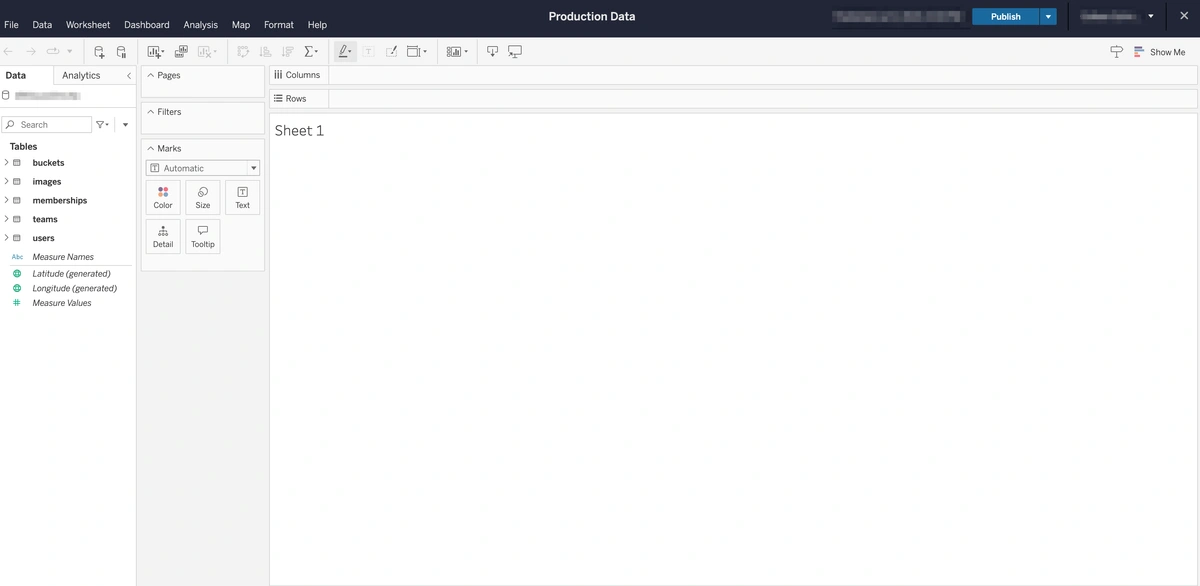
After the data is published, you’ll be taken to the Tableau worksheet view. Not to be confused with an Excel worksheet, this view is unique to Tableau and has its own learning curve.
It should look similar to the screenshot below.
6. Build a Visualization
In Tableau, a visualization is called a viz. This is where you construct the table, chart, graph, map, or any other visual representation you wish to embed for your users. It's important to have a solid understanding of your domain model and your specific objectives at this stage.
This tutorial employs a data model where a team has a bucket, and each bucket contains numerous uploaded images. Our goal is for users to track the number of images uploaded to their bucket on a monthly basis. The most straightforward approach is to choose the relevant data and use Tableau's Show Me feature, which is located in the upper right corner of the sheet.
Specifically, we'll select bucket_id, image created_at, and images(Count).
Once these fields are selected, click on the table view in Show Me, as depicted in the screenshot below.
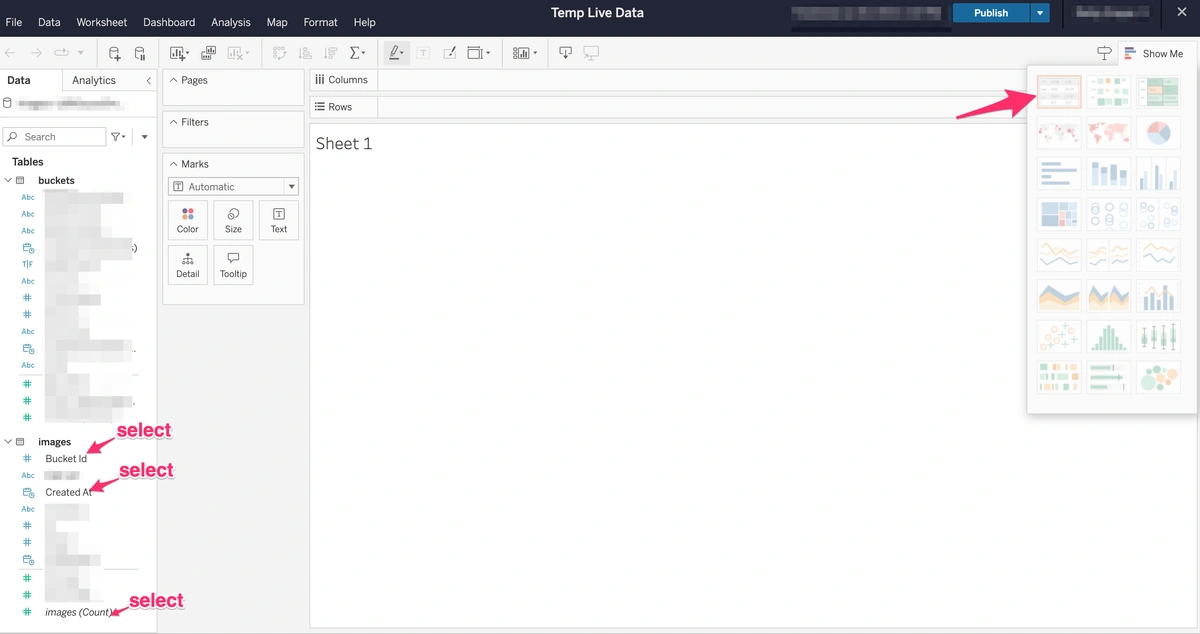
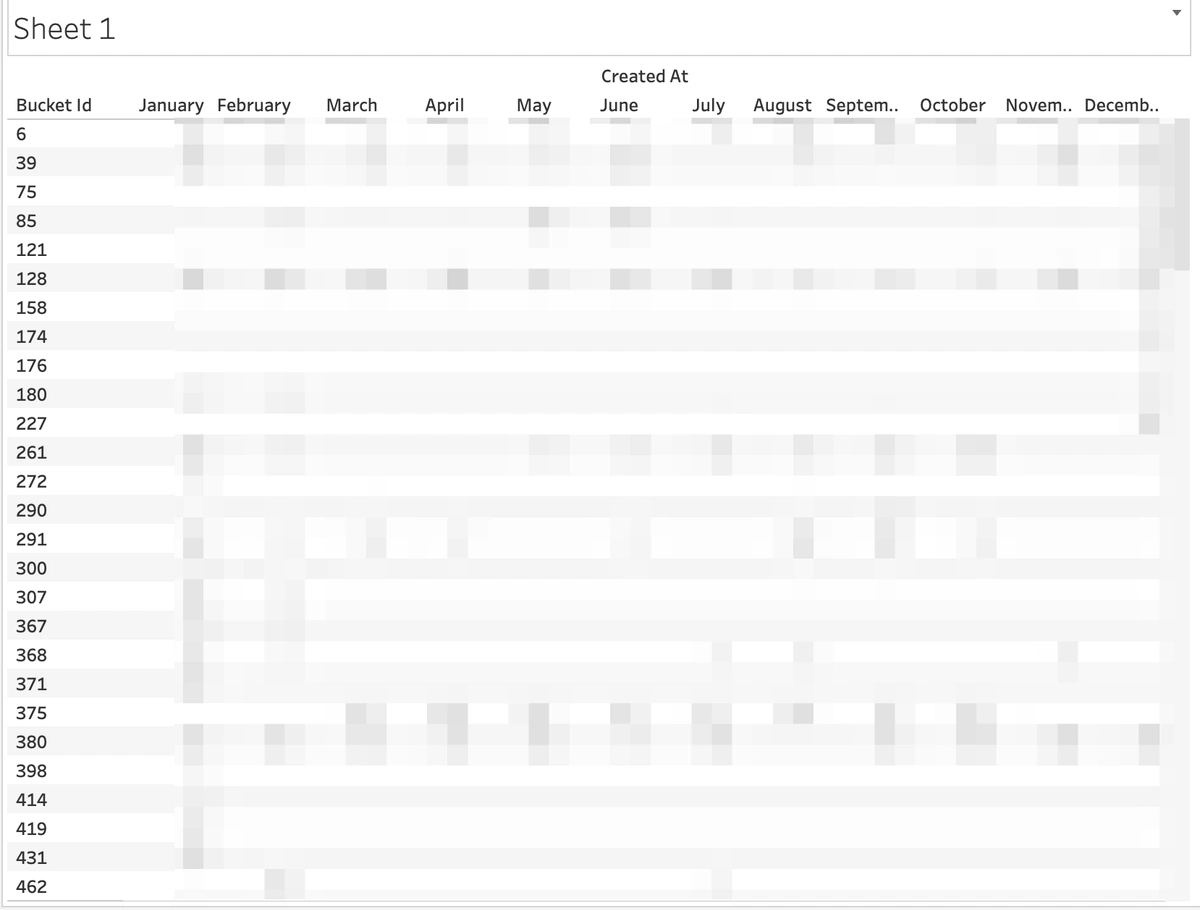
Tableau will generate a table for you, displaying the bucket_id on the left and the count of created images in each individual cell. In its simplest form, this is a Tableau viz!
The table will present a list of all the buckets, each accompanied by its respective image count.
Our primary objective is to enable users to see their images, uploaded by month. Users should only have access to their own bucket and not be able to view data from other users' buckets. This is where authenticated embedding becomes crucial.
7. Configure Tableau for connected apps and authentication
To use authenticated embedding in Tableau, you must configure the software to allow embedding and authentication. The first step is to set up Connected
Apps.
To do this, go back to your main Tableau Cloud dashboard.
From the left pane select Settings → Connected
Apps
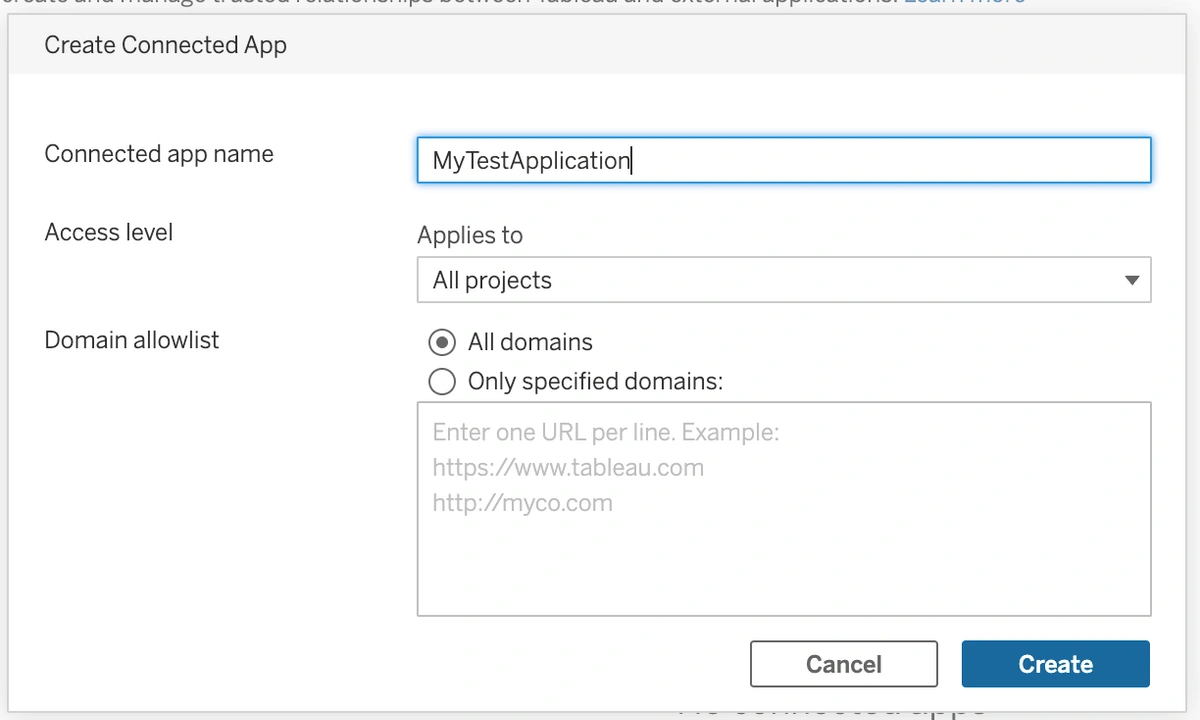
Click the New Connected App drop-down arrow and select Direct Trust.
In the Create Connected App dialog box enter a name for the connected app.
Select a project and a domain allowlist.
Click Create after you have configured these settings.
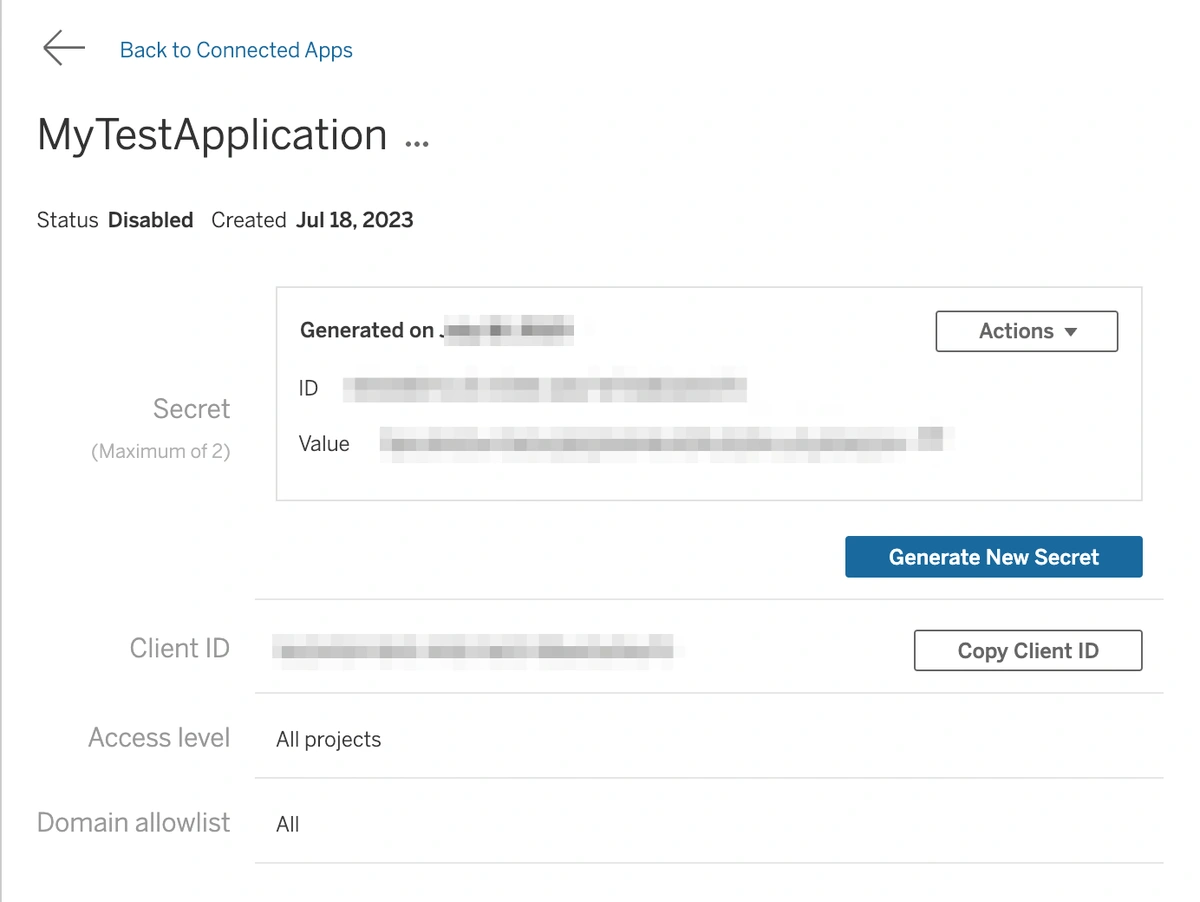
You will be shown a screen with your Client ID , Secret ID and Secret Value.
You will need all three of these values to sign your JWT. Record them somewhere for later use.
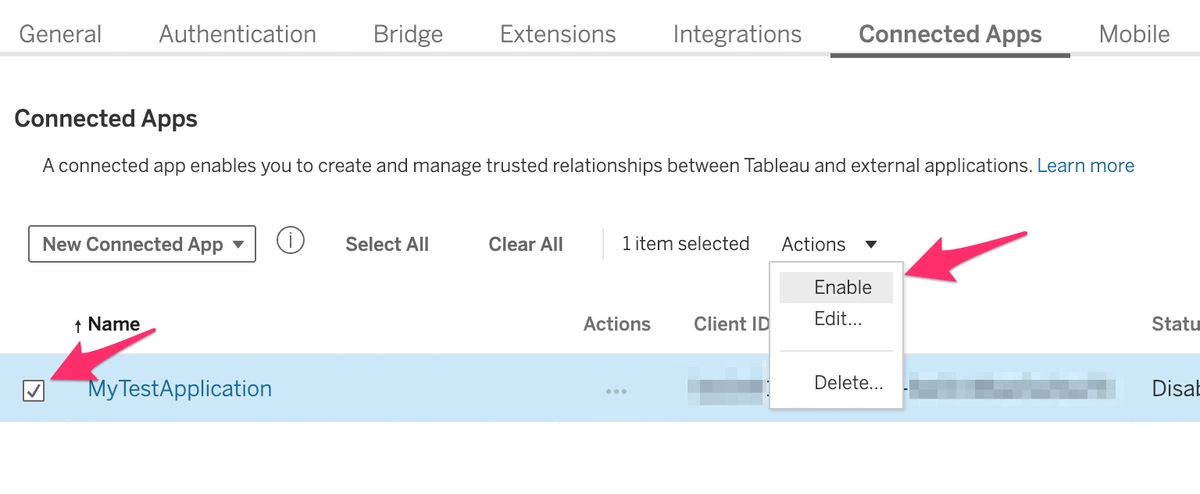
Return to the Connected Apps screen, select the application you just set up, and click Enable.
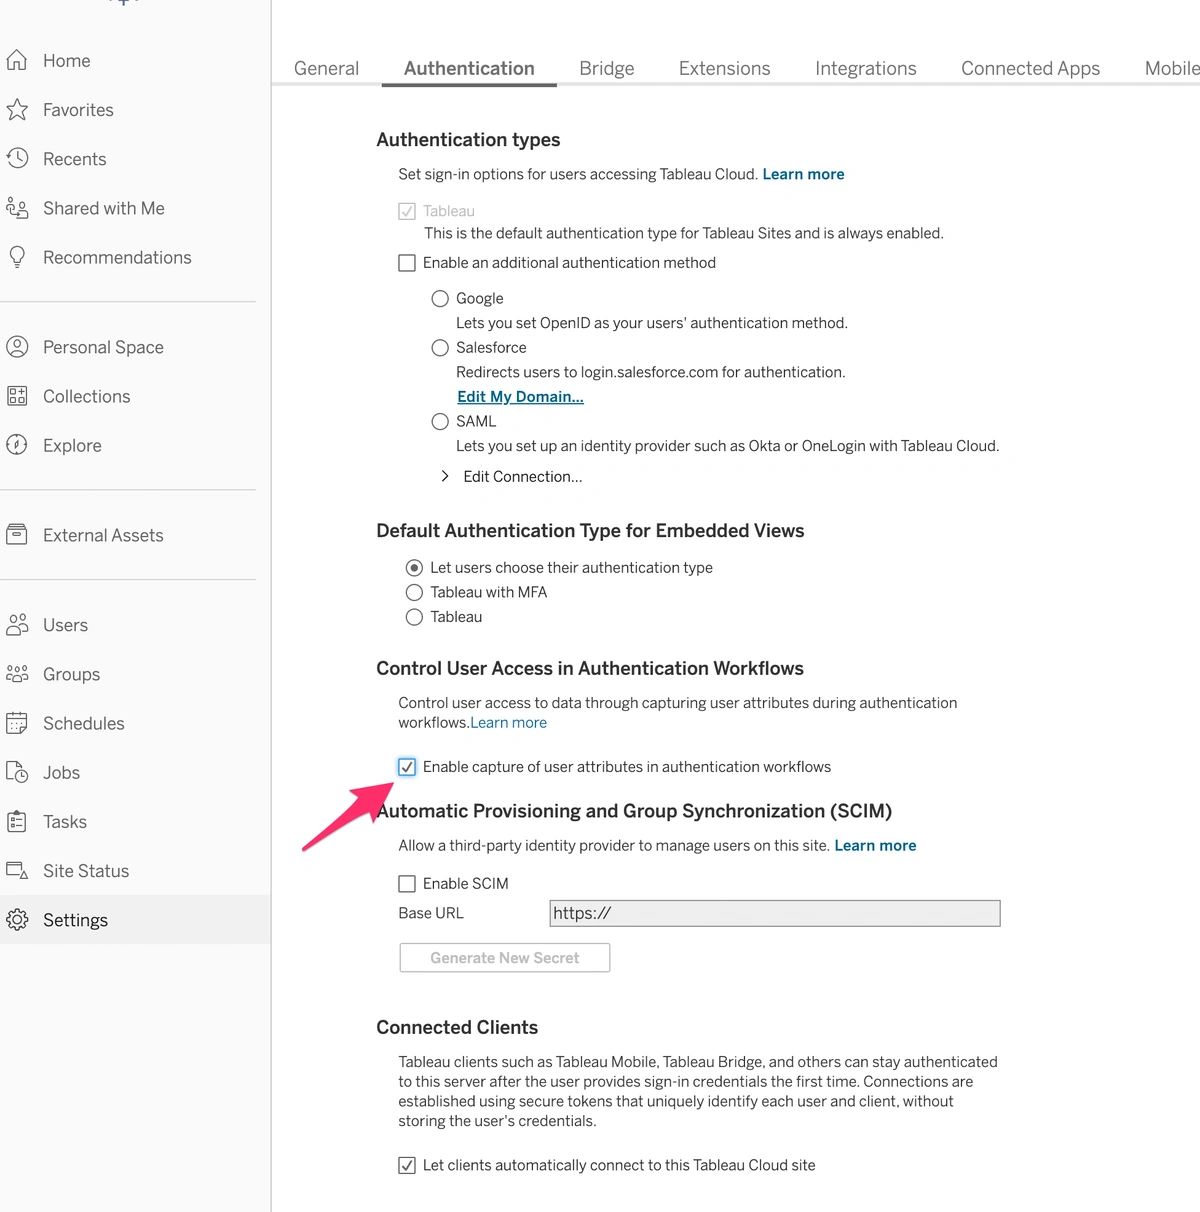
To ensure users only see their respective data, we'll send the bucket_id to Tableau at runtime. However, this requires a few more steps.
First, click on the Authentication tab.
Then, select the option Enable capture of
user attributes in authentication workflows.
Now we’re ready to build out the embedding workflow!
8. Create a JWT
Tableau leverages JWT (Json Web Token) for signed embedding. Depending on your software stack, there are numerous ways to generate a signed JWT.
For further examples, consult the official documentation at https://help.tableau.com/current/online/en-us/connected_apps_direct.htm.
In this guide, let's navigate through an example using Ruby on Rails:
- Install the JWT gem by adding
gem 'jwt' to your Gemfile
- Add the Tableau Secret ID, Tableau Secret Key, and Tableau Client Id to your secrets file
- Create a
TableauTokenService to generate the JWT.
Sample code is below:
class TableauTokenService
  def self.generate_token(user_id, connectedAppClientId, connectedAppSecretKey, connectedAppSecretId)
    require 'jwt'
    require 'securerandom'

    user = User.find(user_id)
    bucket_id = user.current_team.buckets.first.id

    payload = {
      "iss" => connectedAppClientId,
      "exp" => Time.now.to_i + 300,
      "jti" => SecureRandom.uuid,
      "aud" => "tableau",
      "sub" => "your_tableau_email",
      "scp" => ["tableau:views:embed", "tableau:metrics:embed"],
      "bucket_id" => ["#{bucket_id.to_s}"]
    }

    header = {
      'kid' => connectedAppSecretId,
      'iss' => connectedAppClientId
    }

    token = JWT.encode payload, connectedAppSecretKey, 'HS256', header
    token
  end
end
In the controller where you’d like to use the JWT, add a call to the Token service
  user_id = current_user.id
  connectedAppClientId = ENV["TABLEAU_CLIENT_ID"]
  connectedAppSecretKey = ENV["TABLEAU_SECRET_KEY"]
  connectedAppSecretId = ENV["TABLEAU_SECRET_ID"]

  @token = TableauTokenService.generate_token(user_id, connectedAppClientId, connectedAppSecretKey, connectedAppSecretId)
Confirm that your JWT is in a format that matches the Tableau docs.
9. Create a custom field in Tableau
To pass the bucket_id parameter to Tableau, you must set up a custom attribute called a User Function.
Here is a list of all user functions from the official documentation: https://help.tableau.com/current/pro/desktop/en-us/functions_functions_user.htm
Return to your Tableau cloud worksheet.
Select the Analysis tab then choose Create
Calculated Field
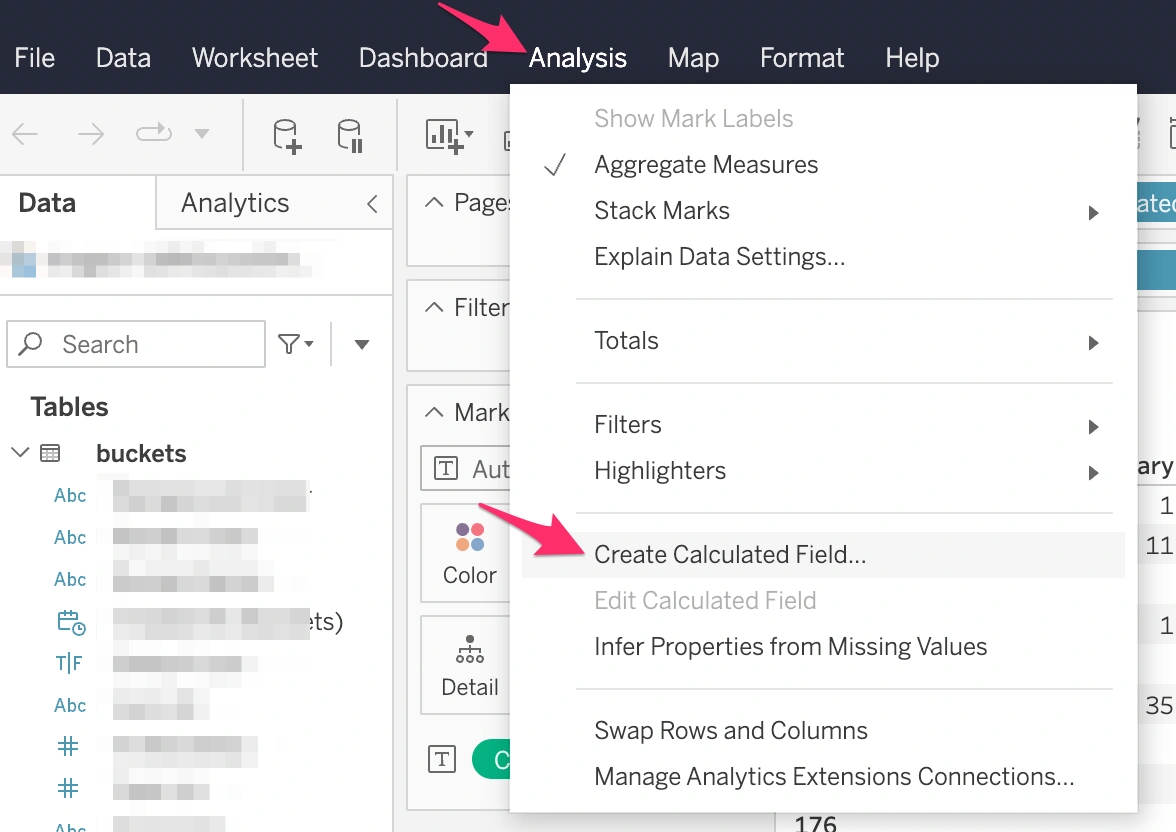
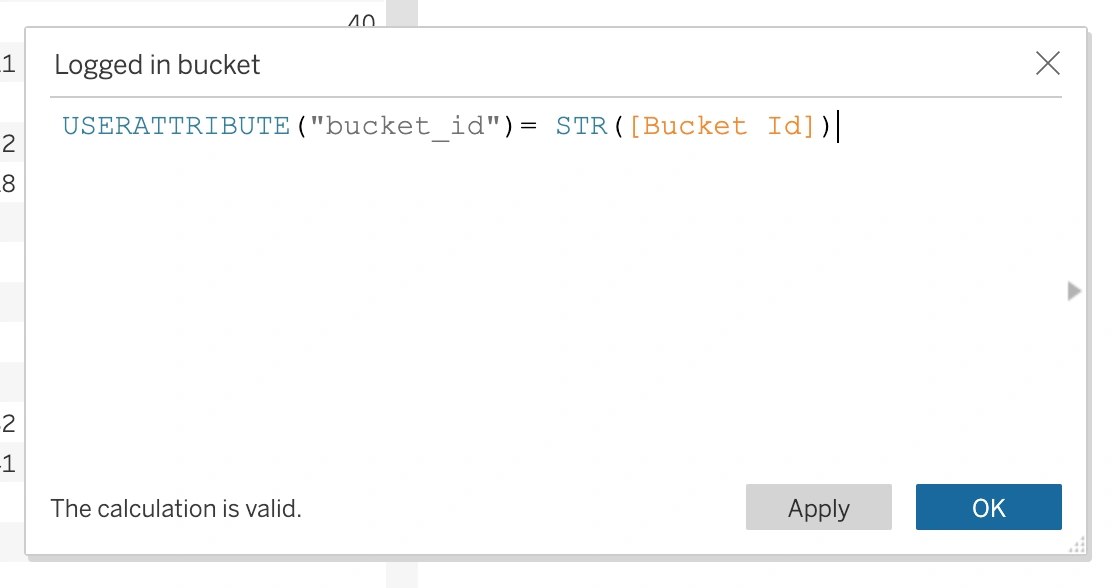
A dialogue box will appear, allowing you to input your custom formula. In this case, we're utilizing a USERATTRIBUTE named bucket_id, which will be provided at runtime by our JWT.
Our formula is USERATTRIBUTE("bucket_id")
= STR([Bucket Id]
This formula will filter the table by the bucket_id passed in. For instance, if the bucket_id passed in is 3, only the row where bucket id = 3 will be displayed to the user.
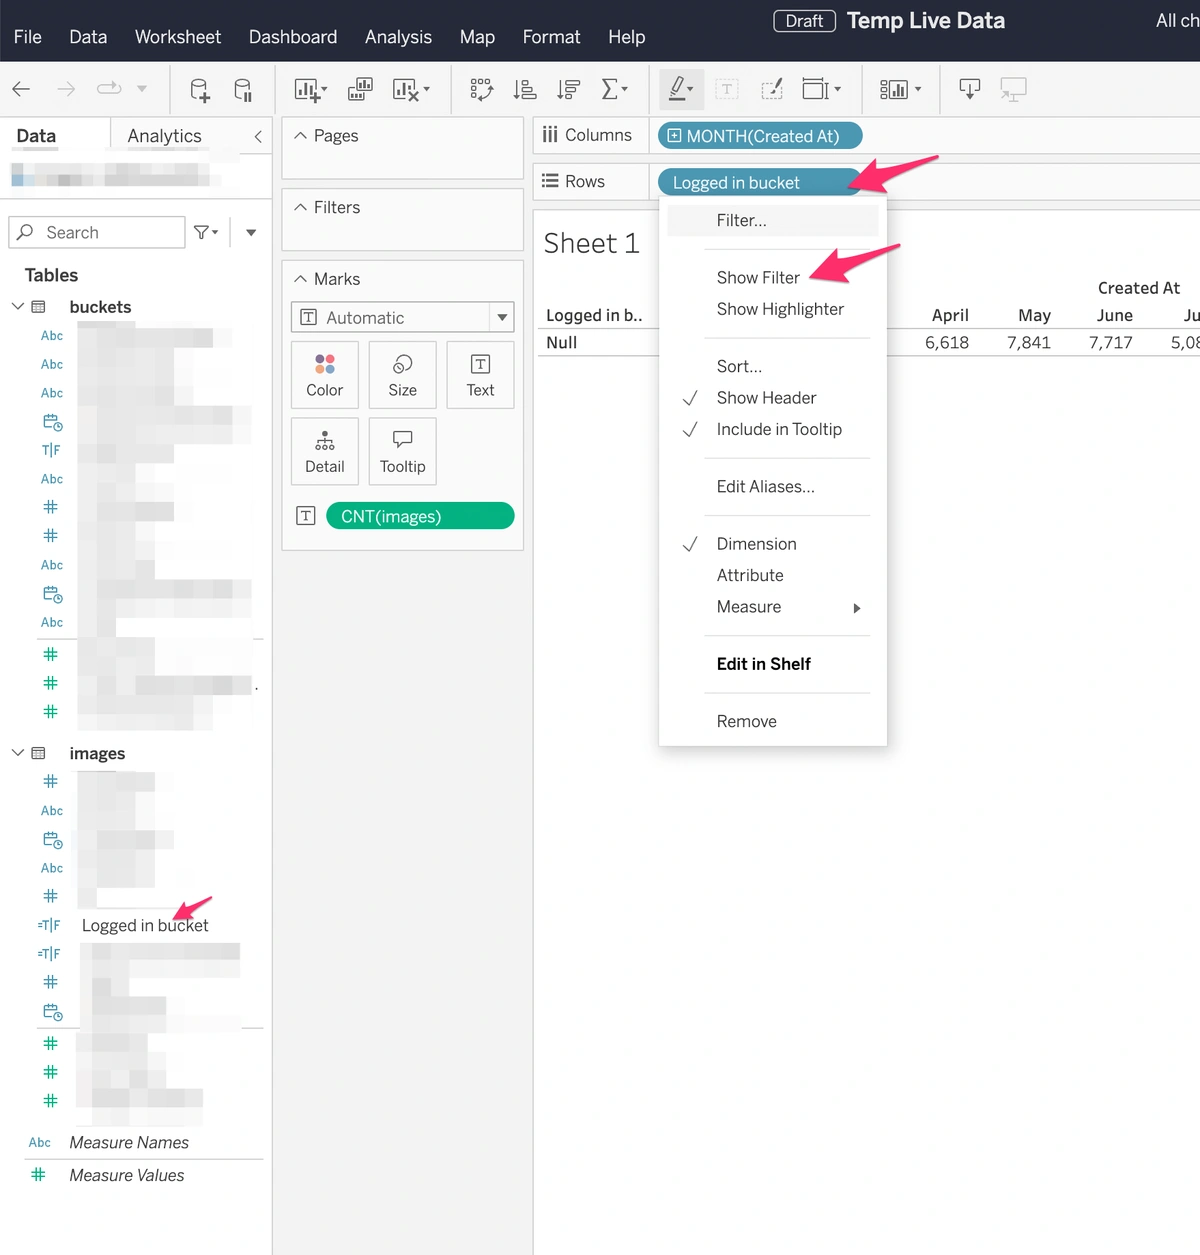
After saving the calculated field, navigate back to your worksheet.
Delete the Bucket Id value in Rows.
Drag the newly created calculated field (found under the table name in the left sidebar) to the Rows value.
Click the down arrow on the Logged in
bucket field. Select Show Filter.
The filter will appear in the filter shelf (located just above Marks).
Click on the filter and choose Edit
Filter
From the List box, select Custom value list
Add a value of True
We only want to show values that evaluate to true for this filter, i.e., where the incoming bucket_id matches the bucket_id in the images table.
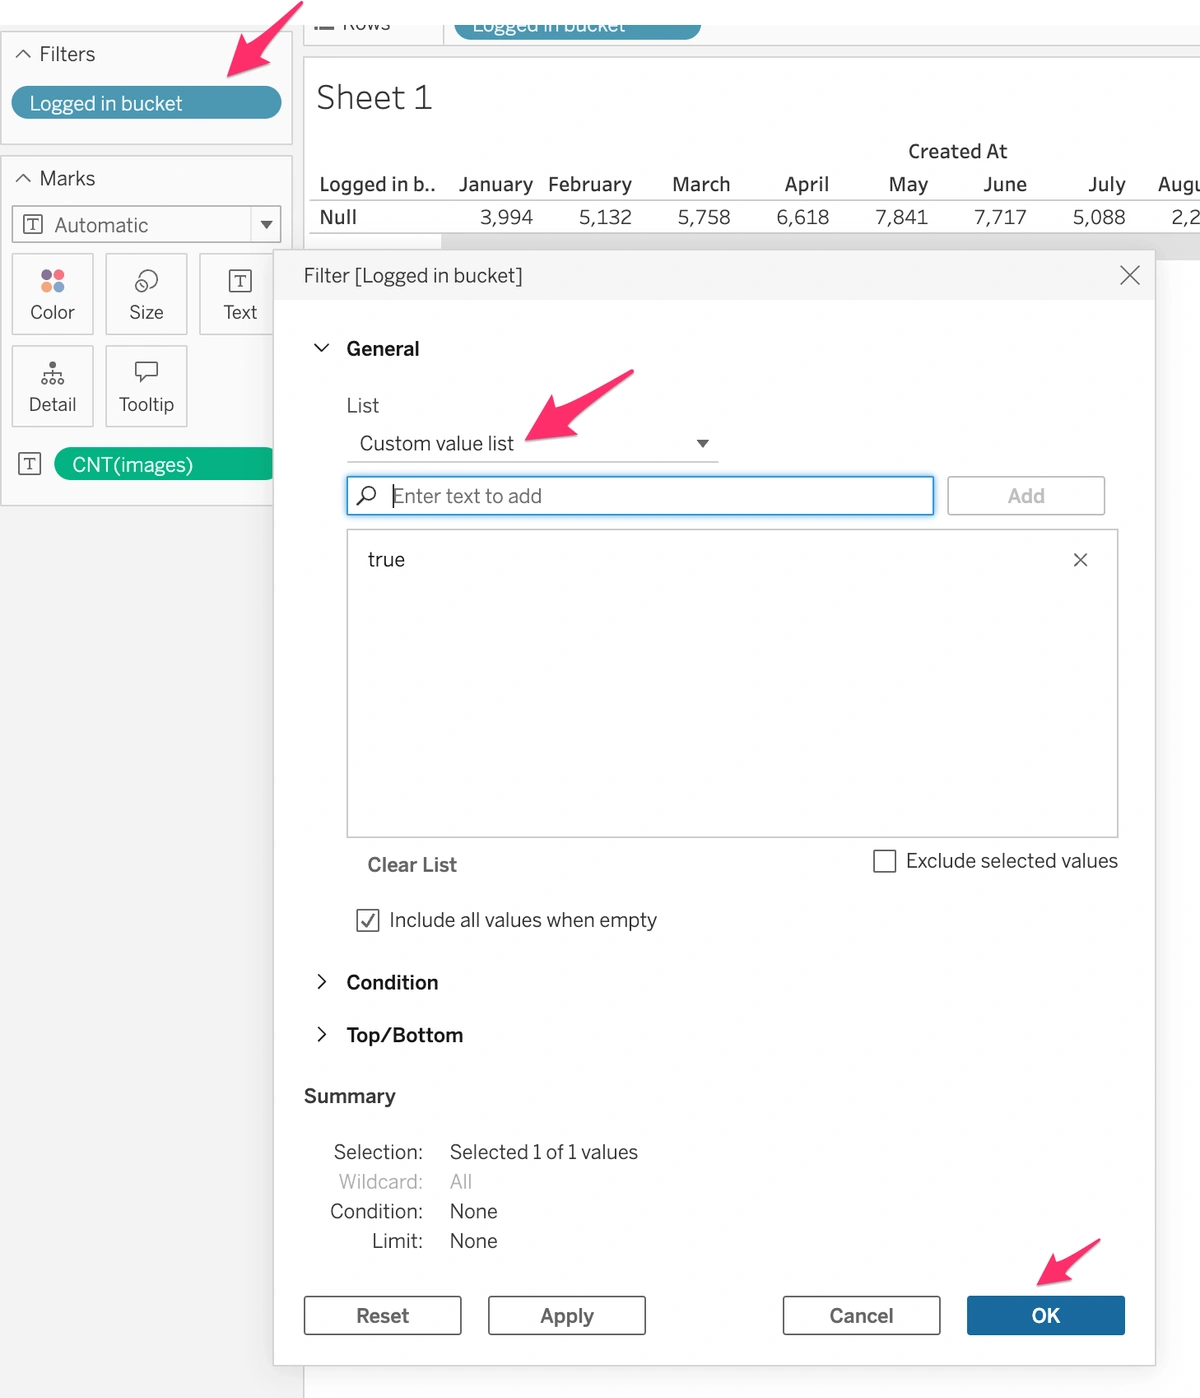
Don’t forget to click Publish in the upper right hand corner!
Fantastic, that completes the Tableau setup. Don't worry if you don't see anything in your worksheet, this is normal. Tableau doesn't provide a way to test user attributes coming from the JWT, so you'll need to integrate the visualization into your application.
10. Embed the tableau viz component
Official documentation: https://help.tableau.com/current/pro/desktop/en-us/embed.htm
Embedding Tableau visualizations has become significantly more straightforward recently, thanks to Tableau's newly rolled out API. Now, you can directly incorporate a tableau-viz component into your code.
To get started, navigate to your workbook and click the Share button found in the toolbar, then select Copy Embed
Code. This action generates a code snippet, which should resemble the one below:
<script type='module' src='https://us-west-2b.online.tableau.com/javascripts/api/tableau.embedding.3.latest.min.js'></script>
<tableau-viz
	id='tableau-viz'
	src='https://us-west-2b.online.tableau.com/t/agreattestsite/views/TempLiveData/Sheet1'
	width='1477'
	height='1155'
	hide-tabs
	toolbar='bottom' >
</tableau-viz>
We are using authenticated embedding, so you will need to add the secure JWT token to the component.
<tableau-viz
  id='tableau-viz'
  src='https://us-west-2b.online.tableau.com/t/agreattestsite/views/TempLiveData/Sheet1'
  width='1477'
  height='1155'
  hide-tabs
  toolbar='bottom'
  token= '<%= @token.to_s %>' >
</tableau-viz>
Add this code to your html where you would like the visualization to appear.
11. View the embed in your application
At this stage, you should be able to boot up your application and view your live Tableau embed.
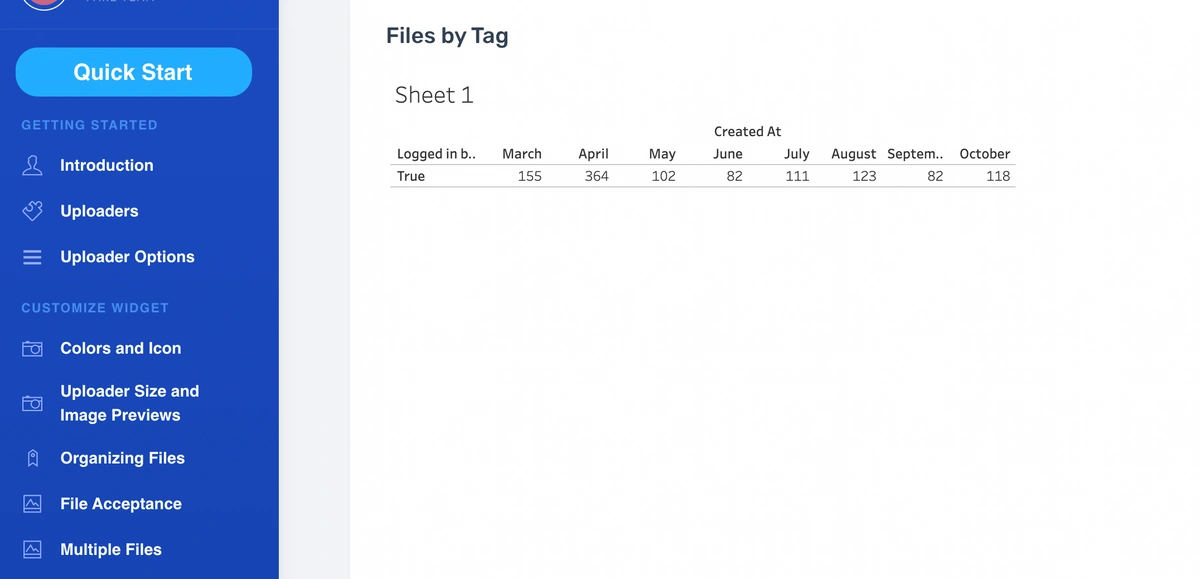
The screenshot below is a Tableau embed (Sheet 1) in a live application. As you can see, the chart properly filtered on the logged in user and is showing only one row - the row associated with the user’s uploads.
12. Summary
To conclude, this guide walked you through the detailed process of integrating a Tableau visualization into a live application, covering key steps such as setting up an account on Tableau Cloud, connecting to a datasource, organizing data, building a visualization, creating a custom field, configuring JWT and finally, embedding the visualization in your application and viewing it.
Tableau's robust capabilities can provide compelling and dynamic visualizations. However, mastering its comprehensive toolset can be quite complex. Hopefully, this guide has helped to demystify the process somewhat and has given you a good starting point for further exploration and experimentation.
It's worth noting that while Tableau is an incredibly powerful tool, simpler solutions are available if you need to allow your users access to their data in a safe way.
One such tool is HelloQuery, which provides a more straightforward, user-friendly way to create interactive tables. Whether you continue to dive deeper into Tableau, or explore other tools like HelloQuery, the important part is to find a solution that suits your unique needs.
Happy embedding!